Bay Area Remote Sensing Analysis
What
Where
When
For
Where
When
For
GIS Analysis
UC Berkeley
2021
LDARCH 110
UC Berkeley
2021
LDARCH 110
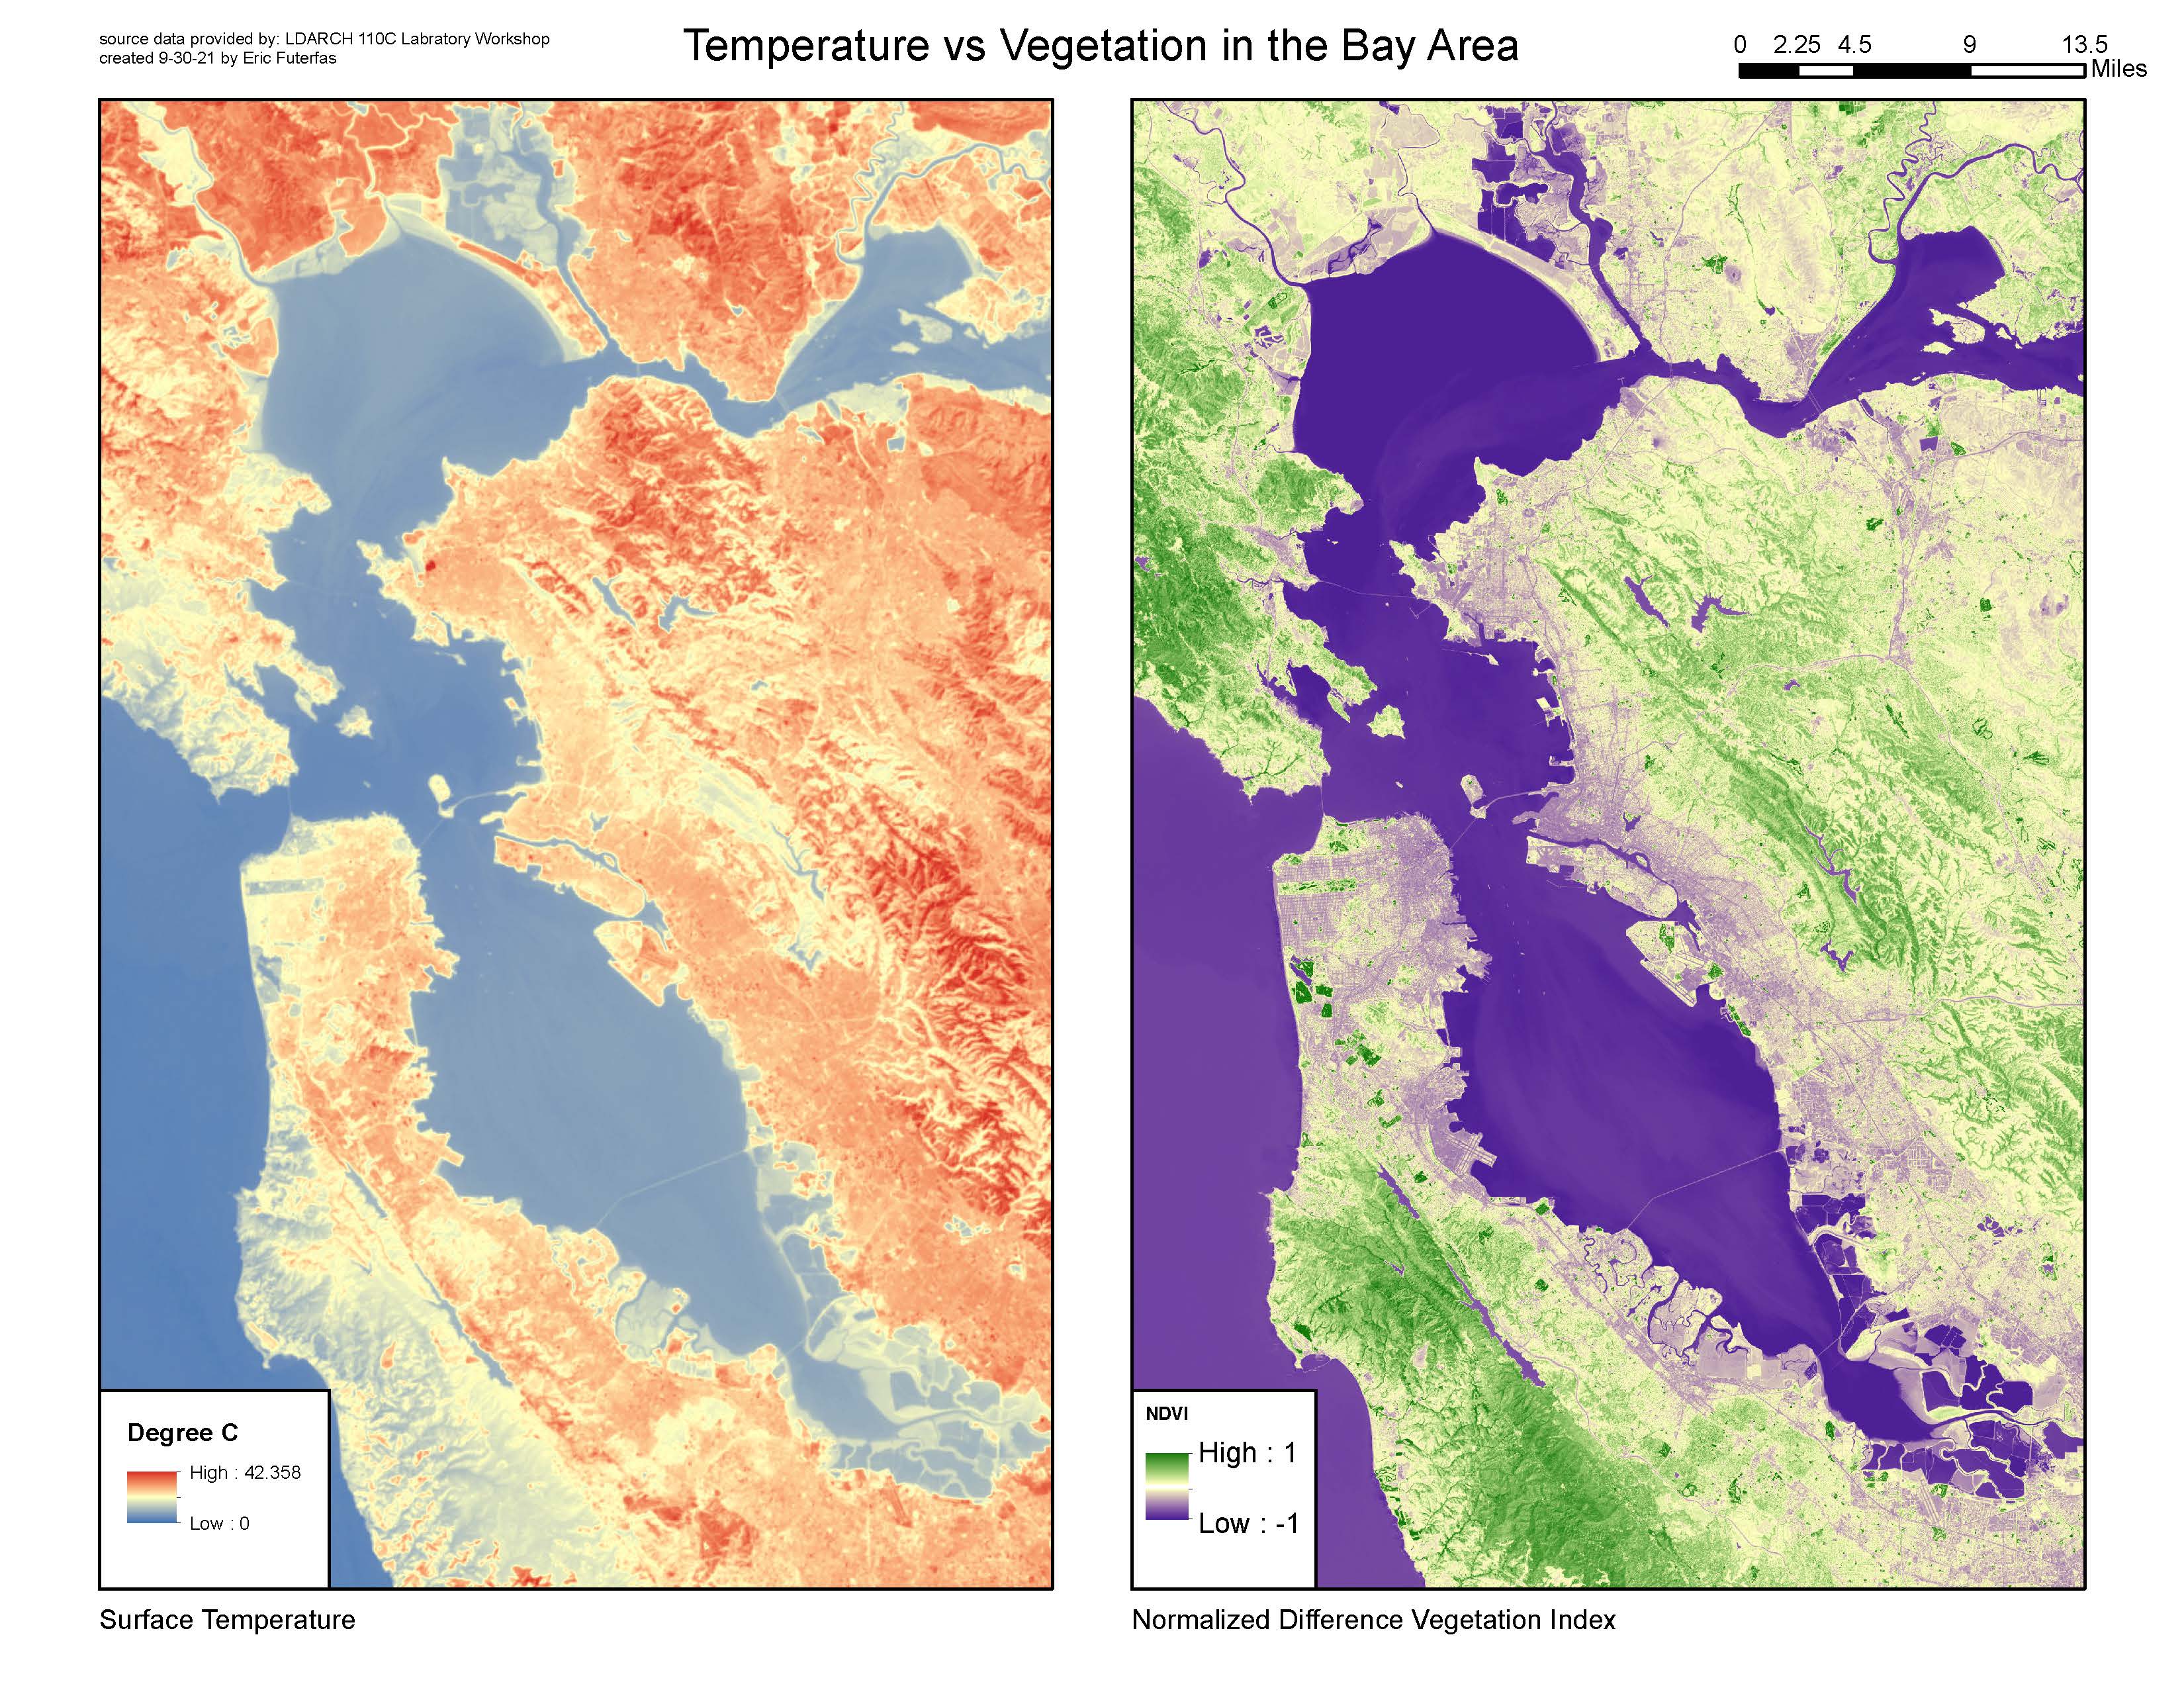
The bay area is known as a sprawling metropolis among a beautiful collage of nature. These maps help to reveal the interraction and behavior of these realms. The Land Surface Temperature (LST) map shows Landsat 8 data of the temperature readings on the surface of earth while the Normalized Difference Vegetation Index map shows the relative amount of vegetation in each pixel at a 30x30m resolution, evaluated using the Infrared spectrum from satellite. Juxtaposing these two maps helps reveal the dramatic inverse correlation that exists between the presence of vegetation and the temperature of an area. This is reflective of how the urban heat island effect can be combatted with vegetation’s ability to absorb and metabolize radiation, as well as evapotranspiring moisture into the air to cool the ambient termperature.